

Deploying a large language model is not merely a matter of launching a container with pre-trained weights and exposing an HTTP port. When the goal is to serve thousands of concurrent users with strict latency requirements, the engineering behind the platform becomes the critical success factor.
We have watched Generative AI evolve from Jupyter notebook prototypes to distributed systems moving terabytes of data per second across GPU memory buses. The difference between a laboratory environment and a production environment lies in how we manage resource contention, performance degradation under load, and fault tolerance.
What Running an LLM in Production Actually Means
A software engineer can easily make an 8-billion parameter model respond in 50 milliseconds on their local workstation. However, when that same model receives 500 simultaneous requests, VRAM saturates, tokens-per-second plummets, and inference queues collapse.
Moving to production requires accepting that compute resources—specifically GPUs—are finite, expensive, and volatile. A robust LLM architecture for real-world environments must address KV (Key-Value) Cache management, intelligent traffic routing, high availability, and extreme observability. We are no longer dealing with traditional stateless microservices; LLM inference is a stateful, compute-intensive process where conversation context and memory occupy physical space in the GPU’s VRAM for the entire duration of the generation cycle.
Components of a Modern LLM Inference Architecture
To build a resilient LLM Cluster, we must segment the platform into well-defined planes of responsibility. Isolating the data plane from the control plane allows us to scale and update components without impacting active users.
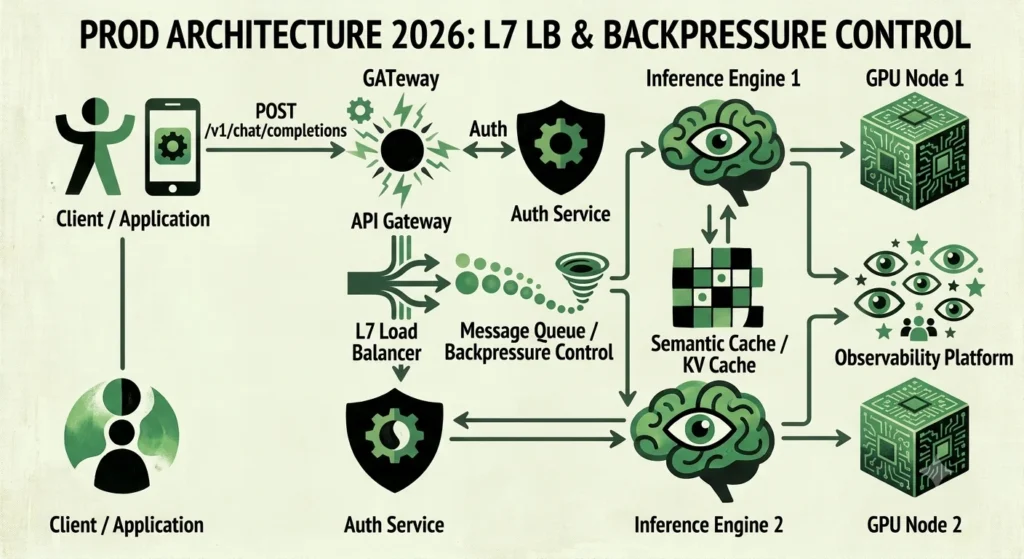
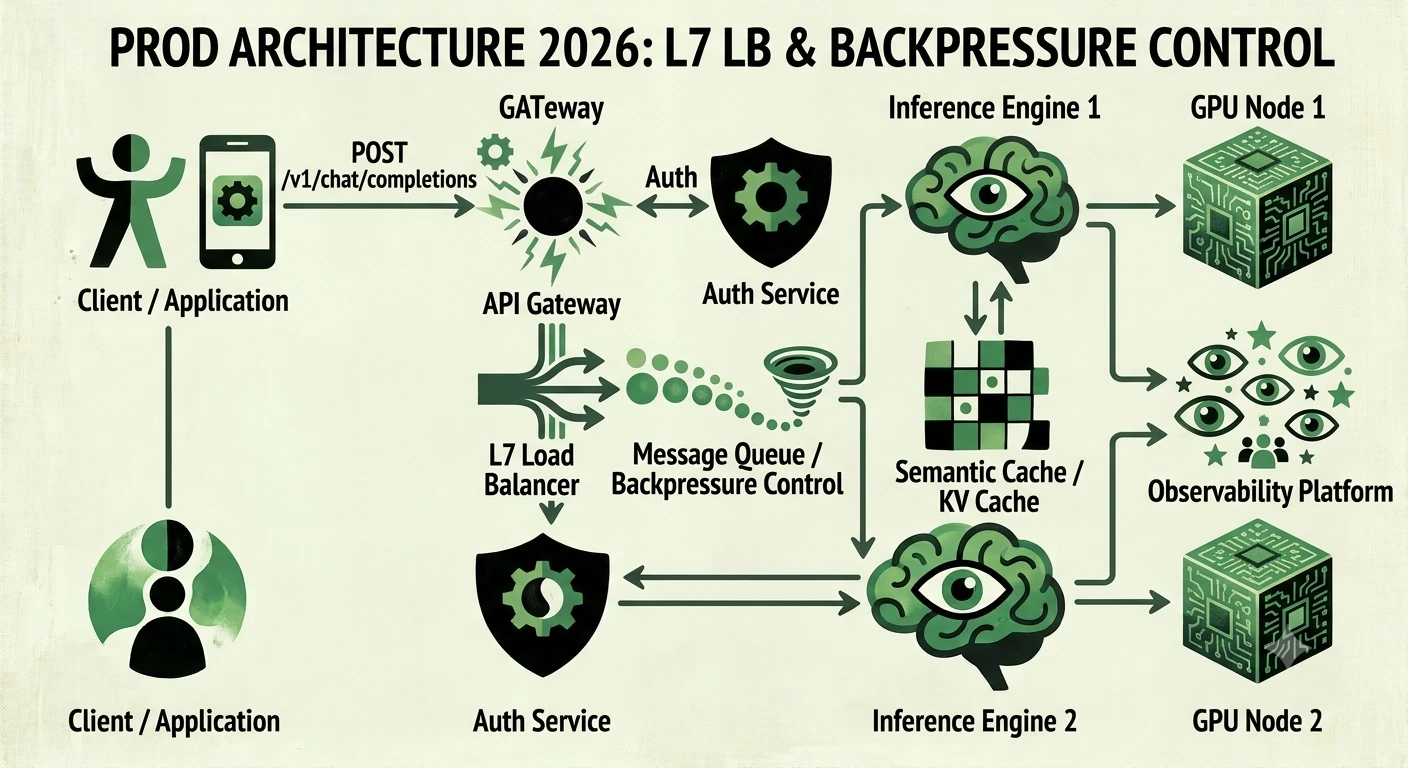
A request traverses multiple layers. It begins at an API Gateway, which handles authentication, authorization, and rate limiting. From there, traffic passes to a load balancer capable of understanding the internal state of inference replicas. If the system is saturated, the request is routed to an asynchronous message broker. Finally, a worker picks up the request, loads context from a semantic cache, and executes inference on the GPU, returning the token stream to the client via Server-Sent Events (SSE) or WebSockets.
Kubernetes as the Control Plane
Kubernetes has cemented itself as the de facto standard for container orchestration, and the MLOps landscape is no exception. However, orchestrating Generative AI workloads forces us to extend its native capabilities.
The primary challenge in Kubernetes is GPU scheduling. Historically, support for accelerator devices required proprietary device plugins. By 2026, the ecosystem has matured towards the use of the NVIDIA GPU Operator (or its AMD and Intel equivalents), which automates driver installation, device plugin configuration, and DCGM (Data Center GPU Manager) deployment for metric exporting.
Scheduling a Pod on a GPU node is non-trivial. Kubernetes does not natively understand VRAM fragmentation. If we have an 80GB GPU and deploy a model consuming 20GB, the default scheduler will block the node, assuming the entire resource is occupied. To overcome this, we rely on technologies like Multi-Instance GPU (MIG) on modern hardware, or open-source projects enabling GPU sharing through time-slicing and extended runtimes.
The decision between physically isolating the GPU (MIG) or sharing its execution time depends entirely on the business model. MIG guarantees fault isolation and memory bandwidth, making it ideal for critical multi-tenant models. Time-slicing is more cost-efficient for workloads tolerating latency spikes, as it allows stacking multiple models on a single, physically indivisible GPU.
A third option, Multi-Process Service (MPS), allows multiple processes to share a single GPU context, reducing context-switching overhead. However, MPS lacks strict memory isolation; if one model experiences a memory leak, it can crash the others. Use MPS when you control the workloads and need maximum throughput, and use MIG when strict tenant isolation is a hard requirement.
The Role of Docker in the Model Lifecycle
Docker remains the foundational tool for packaging, but image design changes drastically when working with large language models.
A common anti-pattern is baking the model weights directly into the Docker image. This generates images ranging from 15 to 50 gigabytes, making cold starts unacceptably slow and saturating container registry bandwidth during rollouts.
The recommended architecture decouples the execution engine from the model weights. The Docker image should contain only the inference binary, CUDA libraries, and Python or C++ dependencies. When the container starts, an init-container or a sidecar downloads the weights from object storage (like S3 or MinIO) to a local empty directory volume.
This separation accelerates MLOps deployment cycles. If we update the inference engine to patch a security vulnerability, the image is only a few megabytes. If we release a new version of the model, we simply update the tag in the volume configuration without rebuilding any images.
Furthermore, leveraging containerd instead of standard Docker daemon can provide performance benefits in Kubernetes environments. Containerd’s snapshter plugins and direct image pulling mechanisms reduce overhead, which is crucial when dealing with large base images containing CUDA toolkits, even if the weights are mounted externally.
Inference Engines for Production Workloads
The inference engine is the heart of the platform. The choice of this component will dictate performance, hardware architecture compatibility, and operational overhead. There is no universal solution; each engine optimizes for a different scenario.
| Engine | Strengths | Recommended Use Cases | Limitations |
|---|---|---|---|
| vLLM | PagedAttention, high throughput, wide model support | General-purpose APIs, high traffic spikes | High initial VRAM consumption |
| SGLang | RadixAttention, extreme prefix caching, optimal for RAG | Complex agents, long system prompts | Growing ecosystem, fewer supported architectures |
| TensorRT-LLM | Pure performance, graph compilation, native FP8 | Closed NVIDIA environments, ultra-low latency | Steep learning curve, compilation overhead |
| llama.cpp / Ollama | Versatility, CPU/GPU support, low consumption | Edge computing, prototypes, GPU-poor on-prem | Limited throughput, not built for high concurrency |
vLLM has positioned itself as the industry standard for OpenAI-compatible servers. Its magic lies in PagedAttention, which manages the KV Cache memory much like an operating system manages virtual memory. This eliminates fragmentation and allows processing significantly larger batches.
SGLang has gained serious traction in architectures heavily dependent on complex prompting. It uses RadixAttention to cache the intermediate calculations of prefixes in a highly efficient radix tree structure. If thousands of users query a 10,000-token RAG document, SGLang processes that context once and caches it, responding to subsequent queries in milliseconds.
TensorRT-LLM is the go-to choice when latency is king and the hardware vendor is exclusively NVIDIA. It requires compiling the model into an optimized graph, which penalizes flexibility, but rewards with unmatched inference speed through kernel fusion and native support for reduced precision formats.
For development environments or edge deployments where data center GPUs are not an option, llama.cpp and Ollama allow running quantized models on consumer hardware or CPUs. They are excellent tools for local testing, but fall short in a production cluster that must sustain high concurrency.
Performance Optimization in LLM Inference
Serving an LLM at scale demands squeezing every last compute cycle out of the GPU. Architectural optimizations are just as important as the choice of the engine itself.
The concept of Continuous Batching revolutionized LLM inference. In static batching, the server waits until it has N requests, processes them as a batch, and returns all responses. If one request generates 500 tokens and another generates 2, the GPU sits idle waiting for both to finish. Continuous batching injects and ejects requests from the batch at every generation step. As soon as a user receives their response, their slot is freed, and a new request enters the batch. This multiplies throughput by orders of magnitude.
The KV Cache is the primary bottleneck. Storing the context of a conversation consumes VRAM rapidly. For every token in the context window, the model stores Key and Value tensors across all layers and attention heads. Optimizing this space involves applying Prefix Caching. If all requests share a system prompt (e.g., formatting instructions or context documents), the engine calculates the KV tensors once and reuses them for all users.
Furthermore, modern models leverage Grouped-Query Attention (GQA) or Multi-Query Attention (MQA) to reduce the size of the KV Cache. When selecting a foundation model, verifying that it uses GQA is a critical architectural decision for memory-constrained environments.
Quantization is another critical lever. Running models in FP16 requires twice the memory of INT8 or FP8. Today, formats like AWQ, GPTQ, or NVIDIA’s native FP8 standard allow running 70-billion parameter models on a single 80GB GPU without perceptible quality degradation. Reducing the memory footprint increases the achievable batch size and, consequently, the number of concurrent users per node.
API Gateway and Load Balancing for Language Models
Generative AI traffic has unique characteristics. Connections are long-lived (token streaming) and payload sizes can be massive. A traditional Layer 4 load balancer, based purely on TCP, is insufficient.
We need an API Gateway that understands HTTP/2 and can handle SSE or WebSockets without dropping connections due to timeouts. Tools like Envoy, Kong, or modern NGINX configurations are the standard here.
Load balancing for LLM inference cannot rely on simple Round Robin algorithms. If we send the same amount of traffic to a replica generating a 2,000-token response as we do to a replica just starting a 10-token response, the first replica will saturate its VRAM.
The correct strategy is Least Connections, or better yet, routing based on the internal queue length of each engine. Modern inference engines expose real-time metrics about the number of waiting requests. An intelligent load balancer, like Envoy configured with external admission control logic, can query these metrics and route traffic to the least loaded replica.
The API Gateway is also responsible for applying per-user quotas, masking sensitive data (PII) before it reaches the model, and translating protocols. For instance, internal applications might communicate via gRPC to minimize network overhead, while the Gateway exposes an OpenAI-compatible REST API externally.
Queue Management and Backpressure Control
Backpressure is an inevitable phenomenon in an LLM Cluster. When incoming traffic exceeds the token generation capacity of the GPUs, the system must decide whether to degrade latency for all users or reject new requests.
A professional architecture implements decoupled queueing systems. Instead of having the client hold an open HTTP connection for minutes, the API Gateway accepts the request, drops it into a message broker, and returns an asynchronous job identifier.
| Technology | Messaging Model | Suitability for LLM Inference |
|---|---|---|
| Redis Streams | In-memory, low latency | Ideal for short-lived queues and response caching |
| NATS | Lightweight Pub/Sub, extremely fast | Excellent for dynamic replica routing |
| Kafka | Distributed log, persistent | Useful if auditability or request replay is needed |
| RabbitMQ | Classic queues, complex routing | Functional, but unnecessarily heavy for pure streaming traffic |
Redis Streams or NATS are generally the preferred options. They offer single-digit millisecond latency and handle backpressure natively. Inference workers consume from these queues at their own pace. If the queue grows beyond a configured threshold, the API Gateway can start returning HTTP 429 (Too Many Requests) errors or redirecting users to a smaller, faster model, applying graceful degradation.
For purely synchronous workflows where the user demands to see tokens generated in real-time, the queue is managed internally within the load balancer or inference engine. However, it is imperative to configure strict max queue size limits. Once that limit is breached, connections must be severed for the sake of overall cluster stability.
Horizontal Scalability of an LLM Cluster
Scaling traditional microservices in Kubernetes relies heavily on CPU utilization metrics. If CPU exceeds 70%, the Horizontal Pod Autoscaler (HPA) spins up a new replica. In the AI world, CPU is almost never the bottleneck; GPU VRAM and compute cycles are.
To scale an LLM Cluster, we need custom metrics. The Kubernetes HPA must be configured to read external metrics from Prometheus, such as the number of active requests per GPU, queue wait times, or KV Cache memory utilization.
The most complex problem regarding horizontal inference scaling is the cold start. Downloading the weights of a 70B model to a new node, loading them into VRAM, and initializing the inference engine can take several minutes. If we rely purely on reactive scaling, by the time the new replica is ready, the traffic spike has passed, leaving us with expensive idle infrastructure.
The architectural solution involves two combined strategies:
- Controlled Overprovisioning: Maintain pre-heated idle replicas using Kubernetes PriorityClasses. Low-priority “pause” pods are deployed to occupy space on GPU nodes. When a traffic spike hits, high-priority inference pods evict the pause pods, taking their place immediately without waiting for new machines to be provisioned.
- Predictive Scaling: Analyze historical usage patterns to scale the cluster before predictable spikes occur (e.g., at 9:00 AM when users start their workday).
For physical node scaling, the Kubernetes Cluster Autoscaler must be configured with specific GPU node groups, utilizing spot or reserved instances depending on the platform’s cost-availability balance. Tools like KEDA (Kubernetes Event-Driven Autoscaling) can also be integrated to scale based on the depth of Redis or NATS queues, providing a more granular response to backlog growth than standard HPA.
Prompt and Embedding Caches
Caching is the secret weapon for reducing costs and improving latency. A complete LLM architecture implementation requires multiple caching layers.
The first layer is prefix caching at the engine level, as described earlier. The second layer is semantic caching at the API level. Why route a request through the GPU if the exact same question has already been answered?
Tools like Redis or lightweight vector databases can store responses to previous prompts. When a new request arrives, the system calculates the embedding of the prompt and searches the vector database. If a match is found with a high degree of similarity (e.g., 0.99 cosine similarity), the cached response is returned directly, bypassing the GPU entirely. This technique is extraordinarily effective in customer support systems or internal bots where many repetitive queries occur.
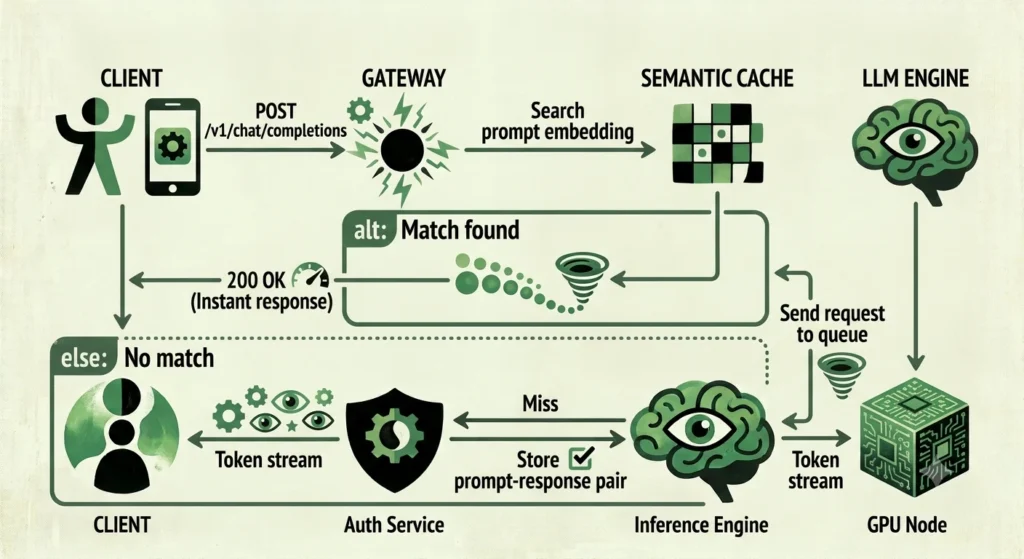
Additionally, embedding models (necessary for RAG and for the semantic cache itself) must be served efficiently. Deploying a separate cluster of smaller, faster embedding models, optimized for massive batching on CPUs or low-profile GPUs, saves expensive resources on the main LLM cluster.
Platform Observability
You cannot optimize what you cannot measure. Observability in an LLM cluster transcends the typical CPU and RAM dashboards. The platform must be instrumented to capture domain-specific inference metrics.
The standard cloud-native observability stack consists of Prometheus for metric scraping, Grafana for visualization, Loki for logs, and Tempo or Jaeger for distributed tracing. OpenTelemetry acts as the glue, standardizing instrumentation across languages and components.
Critical metrics to monitor are divided into two categories:
- System performance metrics: VRAM usage, SM (Streaming Multiprocessor) occupancy, GPU temperature, and PCIe bus bandwidth.
- Business and inference metrics: Time To First Token (TTFT), Time Per Output Token (TPOT), queue latency, and OOM (Out of Memory) error rates.
Distributed tracing is vital for understanding where time is lost. An OpenTelemetry trace for an inference request should span from the API Gateway, through the semantic cache check, queue wait time, and finally break down the time inside the inference engine between the prefill phase (prompt processing) and the decode phase (token generation).
Structured logs in Loki allow for failure correlation. If a GPU starts throwing ECC memory errors, Loki enables us to cross-reference that log with the exact requests executing on that hardware at that moment, streamlining post-mortem diagnosis.
Storage Management and Model Lifecycle
Storage in a Generative AI cluster must satisfy opposing needs: hosting model weights of tens of gigabytes while simultaneously supporting high read concurrency to accelerate cold starts.
The MLOps model lifecycle flow demands a centralized registry. Tools like MLflow or a self-hosted Hugging Face Hub act as the source of truth. When a new model is validated and promoted to production, it is published to this registry.
From a Kubernetes storage infrastructure perspective, the best practice is to use persistent volumes backed by object storage (S3) for the registry repository, and local NVMe SSDs (Local Persistent Volumes) mounted on GPU nodes for weight loading.
If all pods attempt to download a 30GB model from S3 simultaneously during a scale-up event, the cluster network will saturate. To mitigate this, nodes are provisioned with large local disks, and a daemonset or init-container downloads the model to the local SSD once per node. Inference pods scheduled on that node subsequently mount the pre-populated local volume, reducing load times from minutes to seconds.
End-to-End Security
Security in an LLM architecture encompasses traditional infrastructure hardening and the new attack vectors native to Generative AI.
At the network level, GPU nodes must be isolated in private subnets with no direct internet access. Only the API Gateway and routing services are exposed. Traffic between the Gateway and inference engines should be encrypted with mTLS (Mutual TLS), ideally managed by a service mesh like Istio or Cilium.
Kubernetes Role-Based Access Control (RBAC) must restrict which engineers can execute pods on GPU nodes, as access to a GPU implies the ability to run arbitrary code on the hardware, which could be exploited for data exfiltration or side-channel attacks.
At the application level, the API Gateway must implement Web Application Firewalls (WAF) capable of detecting Prompt Injection attempts or PII (Personally Identifiable Information) leakage. If the model is connected to external tools (function calling), sandbox security becomes critical. Tools must execute in isolated containers with minimal permissions—using gVisor or Kata Containers—preventing a malicious prompt from executing commands on the underlying infrastructure.
Infrastructure Costs and AI FinOps
GPUs represent the highest operational cost of an LLM cluster, often exceeding 80% of the cloud bill. FinOps applied to MLOps seeks to align this spending with the actual business value generated.
The first cost optimization strategy is consolidation. Instead of relying on small single-GPU nodes, it is financially more efficient (though operationally more complex) to utilize multi-GPU nodes. This allows sharing local storage, high-speed networking, and host CPU/RAM across multiple accelerators.
Using interruptible instances (Spot Instances) for asynchronous workloads is another fundamental lever. If the cluster is processing documents in the background for a RAG pipeline, inference pods can run on Spot nodes. If the cloud reclaims the node, the job returns to the queue and retries on another node. For synchronous interactive traffic, we must stick to On-Demand or Reserved instances.
Model selection impacts cost directly. Using a 70B model to summarize emails is a resource waste. A well-designed architecture implements complexity-based routing: a small 8B model on cheaper GPU clusters handles 90% of the traffic, and only complex queries are routed to a 70B model cluster hosted on high-end hardware.
Recommended Architectures Based on User Volume
Not everyone needs a multi-region deployment of thousands of GPUs. The design must adapt to the operational context.
Scenario 1: Low Internal Load (Up to 50 concurrent users)
For internal departments or advanced prototypes, complexity must be minimized. A single server with one or two consumer-grade GPUs (like RTX 4090) or an entry-level data center GPU (L4 or A10), running vLLM directly on Docker Compose or a single-node Kubernetes cluster (k3s) is sufficient. A reverse NGINX proxy and a basic Prometheus script cover observability needs. The emphasis here is on simplicity and low cost.
Scenario 2: SME or Niche SaaS (100 – 1,000 concurrent users)
Here we need high availability and traffic control. The Kubernetes cluster consists of 3 to 5 GPU nodes. We deploy vLLM or SGLang with replicas distributed for fault tolerance. An API Gateway (Kong or Envoy) manages authentication and routing. Redis is introduced for semantic caching and backpressure queues. Horizontal scaling is reactive, based on VRAM metrics and queue size. Using 8-bit quantized models is vital to maximize concurrent users per GPU.
Scenario 3: Enterprise Platform and Multi-Tenant (+10,000 concurrent users)
The extreme scenario requires a globally distributed deployment. Regional Kubernetes clusters are utilized with geographic routing (GeoDNS). Models are served via TensorRT-LLM to squeeze hardware performance, with dedicated pods per major client to guarantee isolation and Quality of Service (QoS).
The architecture includes a complex intelligent routing layer that decides in real-time which model and which region handles the request based on client network latency and global load. Kafka is used for auditing persistence of every inference. Autoscaling is predictive, orchestrated by Machine Learning systems analyzing hourly usage patterns. Physical nodes leverage MIG to partition large GPUs (H100 or B200) into logical instances, isolating tenants and optimizing compute density. FinOps acts as another architectural component, rotating traffic to cheaper cloud regions during off-peak hours.
Designing infrastructures for Generative AI is a constantly evolving field. Specific tools will change, but the principles of memory management, fault isolation, and traffic control will remain the bedrock for building systems capable of sustaining the next generation of intelligent applications.